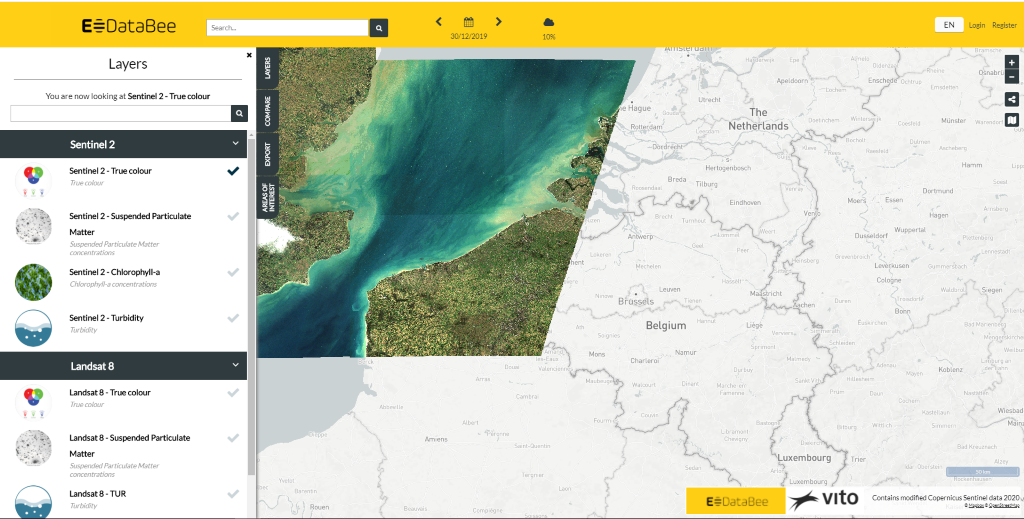
The EoDataBee GeoViewer is a visualization and analysis tool. It allows to easily search data of interest, to compare datalayers and plot time series.
To access the viewer, go to this address: https://viewer.terrascope.be/dcs4cop-nrt/
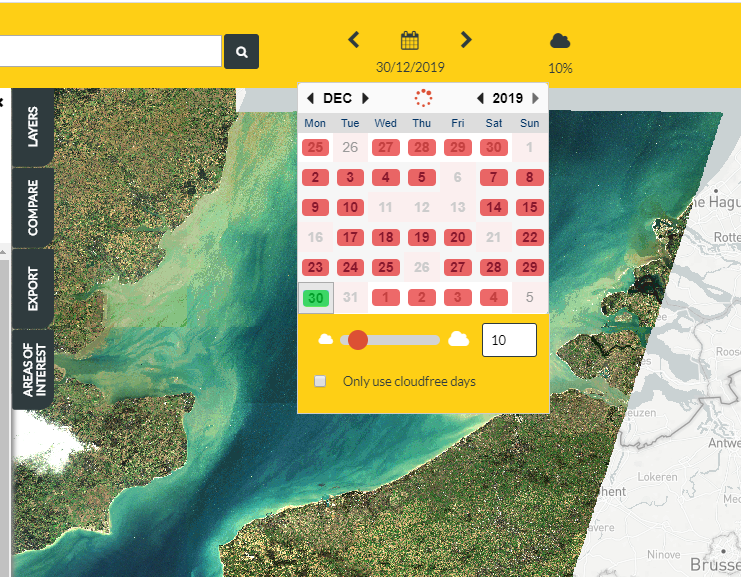
The GeoViewer has a special feature in the calender where users can select the percentage of cloud cover. All data below this cloud cover percentage will be indicated in the calender with a green colour.
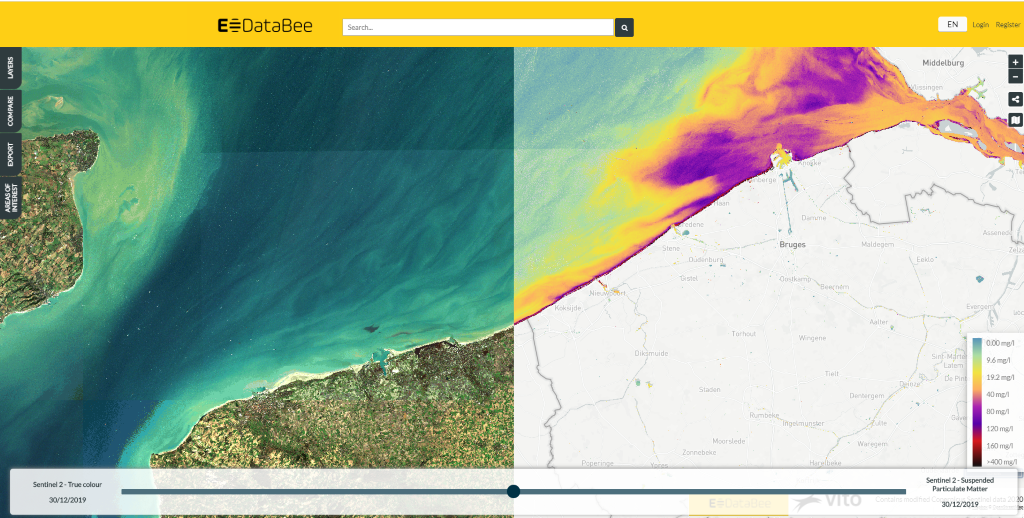
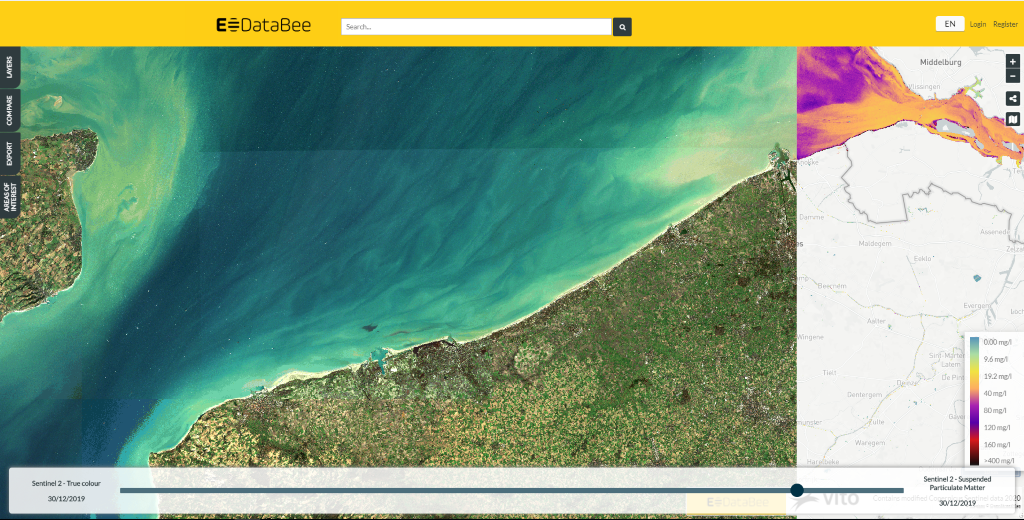
Two data layers can be compared in the viewer. Figure x shows on the left a true colour image, on the right the corresponding SPM map. Also data from different dates can be compared in the same way. By moving the slider, you can adjust the size of one layer or the other.
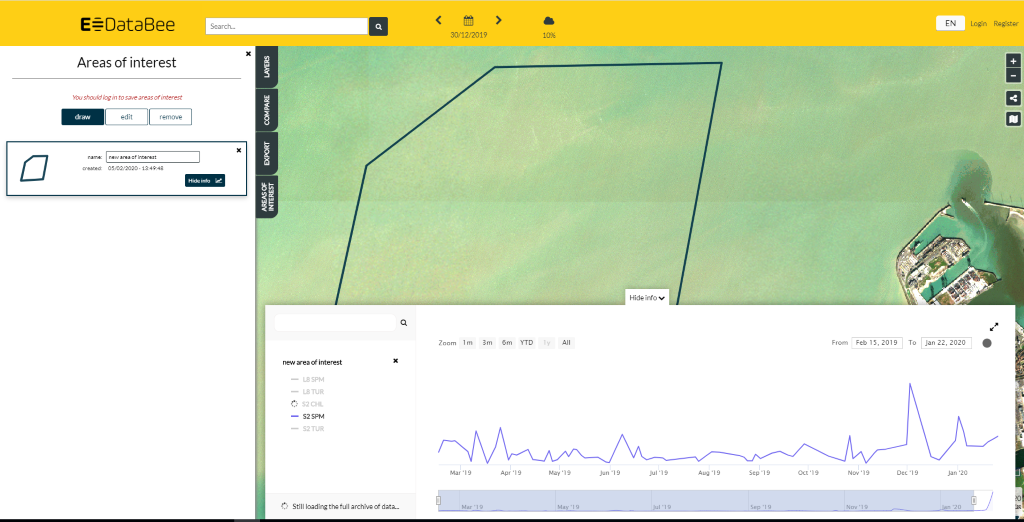
A time series tool allows to select an area of interest and plot all datapoints for selected layers.